🎯 Data Driven Marketing is the future of Marketing! Details & Case Studies >

DATA VISUALIZATION

Make decisions that are based on your dashboard, not your gut.

Dashboards & Reportings

For most people, data is just random figures and words. For us, it is an open book that tells us where your journey to success should take you. Through our data visualization consulting, we make your data visible, processing it to be informative.

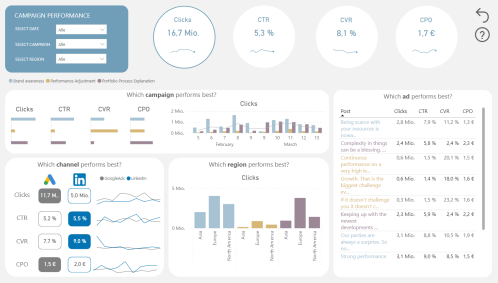
Customized, interactive dashboards ensure that you always have an overview of all relevant data. Trends, patterns and anomalies can be identified quickly, enabling you to react immediately and make data-driven decisions.

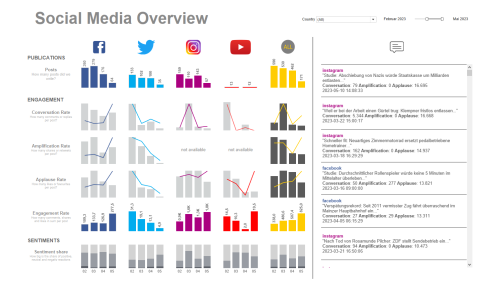
This data can also be made available to all employees, promoting internal transparency of information. In addition to this, we create automated reports that focus on individual target groups, providing you with a deeper insight into specific issues and targets.

And best of all – our automated dashboards and reports are so simple and intuitive that you don’t need any prior technical knowledge. You won’t believe how easy it is to “read” your data and use it for your success. We will be pleased to advise you.

Our data visualization services

INTERACTIVE DASHBOARDS

We define, collect and sort data for you, using it to create interactive visualizations e.g. marketing analytics dashboards. Within the scope of this, we can advise you on the selection of relevant KPIs and their interpretation.

AUTOMATED REPORTS

We create automated individualised reports based on the specific interests and needs of a target group and make these reports available to corresponding recipients. Before doing this, we work together with you to define appropriate data.

AD HOC ANALYSES

If fast reactions to market events are required, we can create conclusive analyses on current topics or requirements at short notice.

DATA STORYTELLING

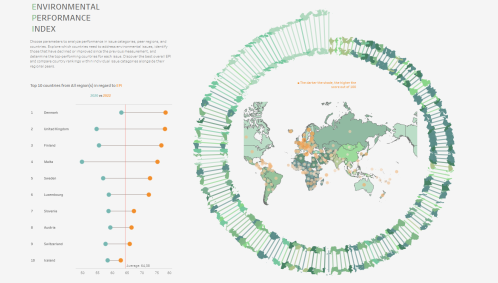
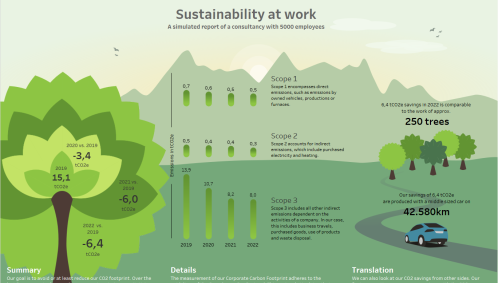
The digital marketing world is our home and we can make your data tell informative stories through marketing data visualization as well as provide you with data-driven recommendations for action.

PROFESSIONAL TOOLS

Our sound analyses are based on professional tools, such as Tableau or Power BI, and the experience of our consultants, who are always expanding their knowledge.

SELF-SERVICE BUSINESS INTELLIGENCE

We show you how to create your own reports and analyses in our tools without your IT department having to get involved. In our data visualization training is knowledge taken one step further and shared with others.

Hopmann Pfeil blau

Data Visualization Trainings

With the HMA Academy, we offer you practice-oriented, first-class training in the field of data visualization: Power BI workshops, Tableau training and more. Book your course and become ready to effectively analyze and visualize your data.

Data-Viz Projects and Case Studies

Selection of our customers

  • Telefonica
  • Allianz
  • Douglas
  • Lavera Naturkosmetik
  • Roche
  • Telefonica
  • Fielmann
  • Telefonica
  • Aachener Grundvermögen
  • Philip Morris International
  • Fresenius

Benefit from exciting data visualizations!

Hello!