INTEGRATION OF TARGET VALUES OR PREDICTIVE VALUES OF DIFFERENT GRANULARITY IN TABLEAU – HOPMANN MARKETING ANALYTICS
Important: It must be possible to adapt the data used for this procedure!
In order to accommodate target values in a Tableau visualization, these values must be available in the data in the correct structure. In this article, we look at the best way to prepare the data in the data source so that we can use it flexibly later in the visualization.
Case 1: Target values are available for each granularity of the observation dimension or are only available at one level
In this case, we look at a metric that can be filtered with different dimensions. If your metric is a percentage, it is best to store the target value with its absolute values so that you can later filter on any dimension in the view. If you have a target value for each granularity, it is relatively easy to prepare the data by simply joining all existing dimensions. This completes the work on the data and you can move straight on to the visualization part.

Case 2: Target values are only available for individual granularities of the observation dimension or are available at several levels
In the event that the target values are only available at a certain granularity and not for others, we have to choose a slightly different procedure, as we would multiply the data here with a join and thus falsify the figures. The first thing that comes to mind here is blending or a relationship in the logical layer of Tableau. If the target values are all at the same granularity level, this is the easiest way.
Example of the target value with a granularity level
We have the population of all regions in Europe as data. The target value is a prediction of how many inhabitants are expected in ten years. However, this target value is not available at region level, but at country level.

In this case, it is worth creating a relationship in Tableau and using it to bring the target value into the visualization. However, we have to be careful when displaying at lower granularity levels. If we now only display France – Brittany, we get the forecast value for the whole of France. We must therefore either use a calculation to check which level we are at in the display and display a value depending on this, or we can also use the method from case 3 for this case.
Tableau calculation: IF COUNTD([Region])>1 THEN AVG(Population forecast in T]) END
Case 3: Target values at several levels of granularity without a 1:1 relationship between observed value and target value
However, in the more difficult case where your target value is available at multiple levels but not all levels or not for all entries at all levels, we need to take a different approach to avoid greater complexity in calculation and visualization.
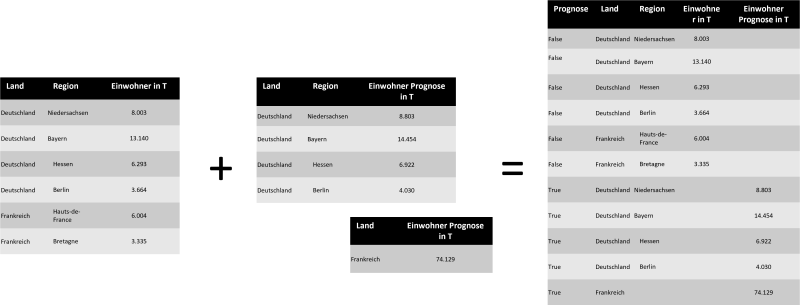
My favorite method for this is to append the data to the table using a union. To do this, you can write the target values in a new column and only fill in the dimensions for which the corresponding target values are available. If there is no target value at a granularity level, this row should not be filled in.

With this data model, we can now also insert target values at different levels, even if these are not filled at all levels, as in the example of France, where we only have the forecast for the entire country, but not the forecast values for the individual regions. It is important to note that we need actual values for all regions of a country so that realistic figures for the respective country can be displayed later in the visualization.
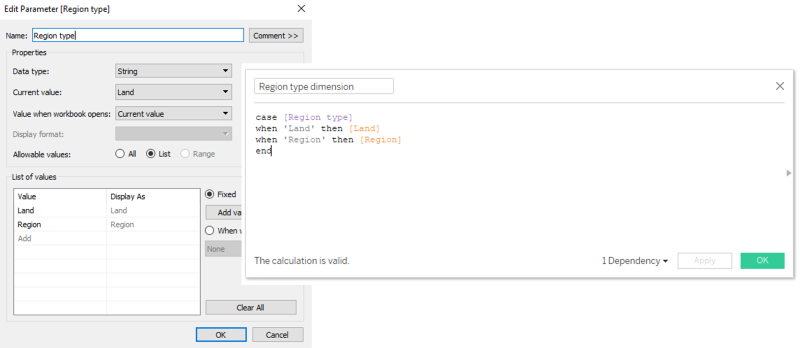
The last point to note is that we need to make the different hierarchies interchangeable using a parameter and incorporate them into the visualization.

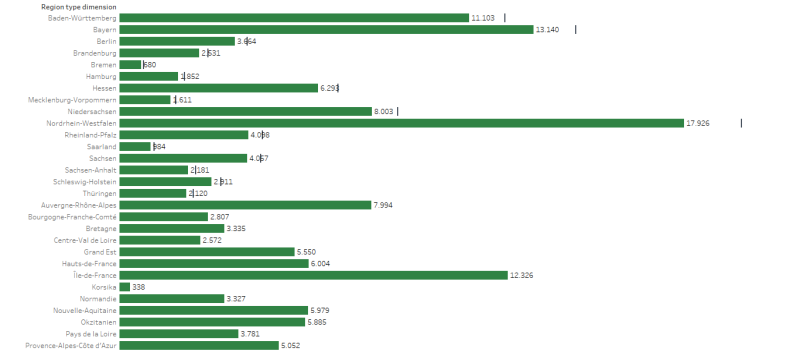
This means we can now filter out the NULL values at the various levels and only display the granularities with actual values and corresponding forecast values (if available).

